Olga Gaffarova

Data Explorer
Data-driven problem solver with experience in creative production, social media, TV ads, and interactive events. Combines stakeholder management and Python skills to uncover inefficiencies and deliver actionable solutions, with Tableau visualizations and Streamlit dashboards.


QS World University Rankings 2026
Objective
According to the QS methodology, the Discovery and Research lens carries the greatest weight (50%), with Academic Reputation (AR) as its key component (30%). The goal of this analysis is to explore which other scores contribute to success in AR, helping us better understand what drives rankings outside of the top tier.
Scope
- Global distribution of top universities (map) and descriptive statistics
- Differences across quartiles of universities
- Correlation patterns between indicators in each quartile
- Which scores most strongly drive Academic Reputation (AR) in the middle quartiles
- Recommendations for undergraduates based on findings
Understanding University Quartiles
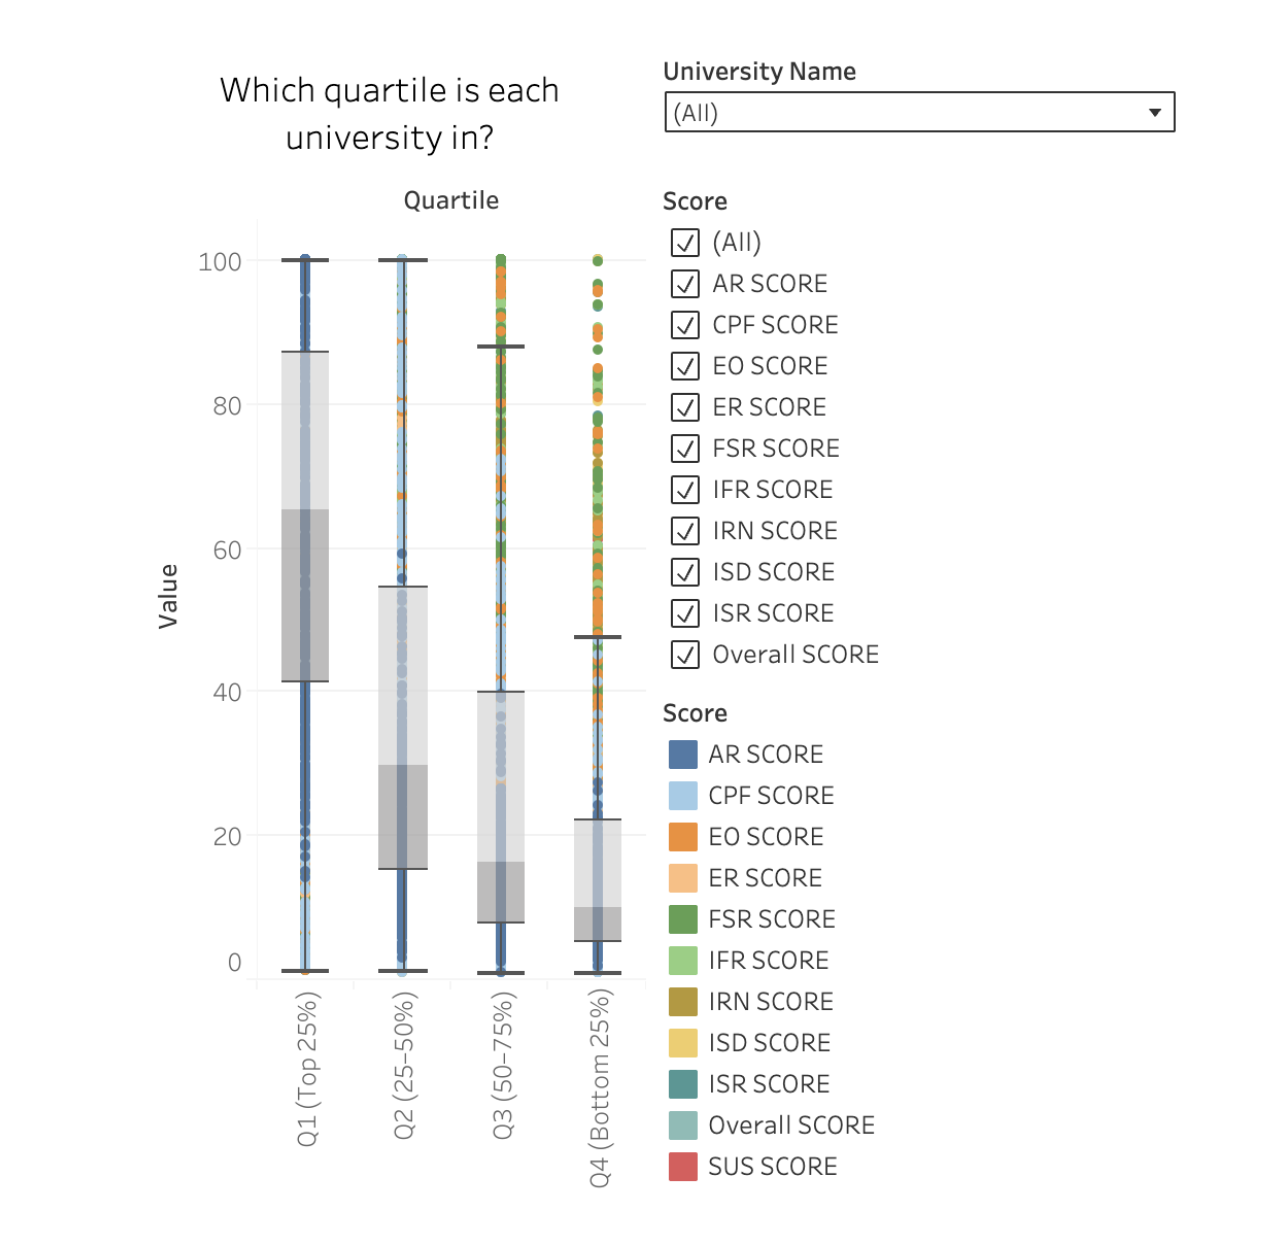
To better understand differences between universities, we split them into four quartiles:
- Q1 (Top 25%) – the highest-ranked universities
- Q2 (25–50%) – upper-middle universities
- Q3 (50–75%) – lower-middle universities
- Q4 (Bottom 25%) – the lowest-ranked universities
We created correlation heatmaps to see how different QS scores relate to each other within each quartile.
Key Drivers of Academic Reputation Beyond the Top Tier
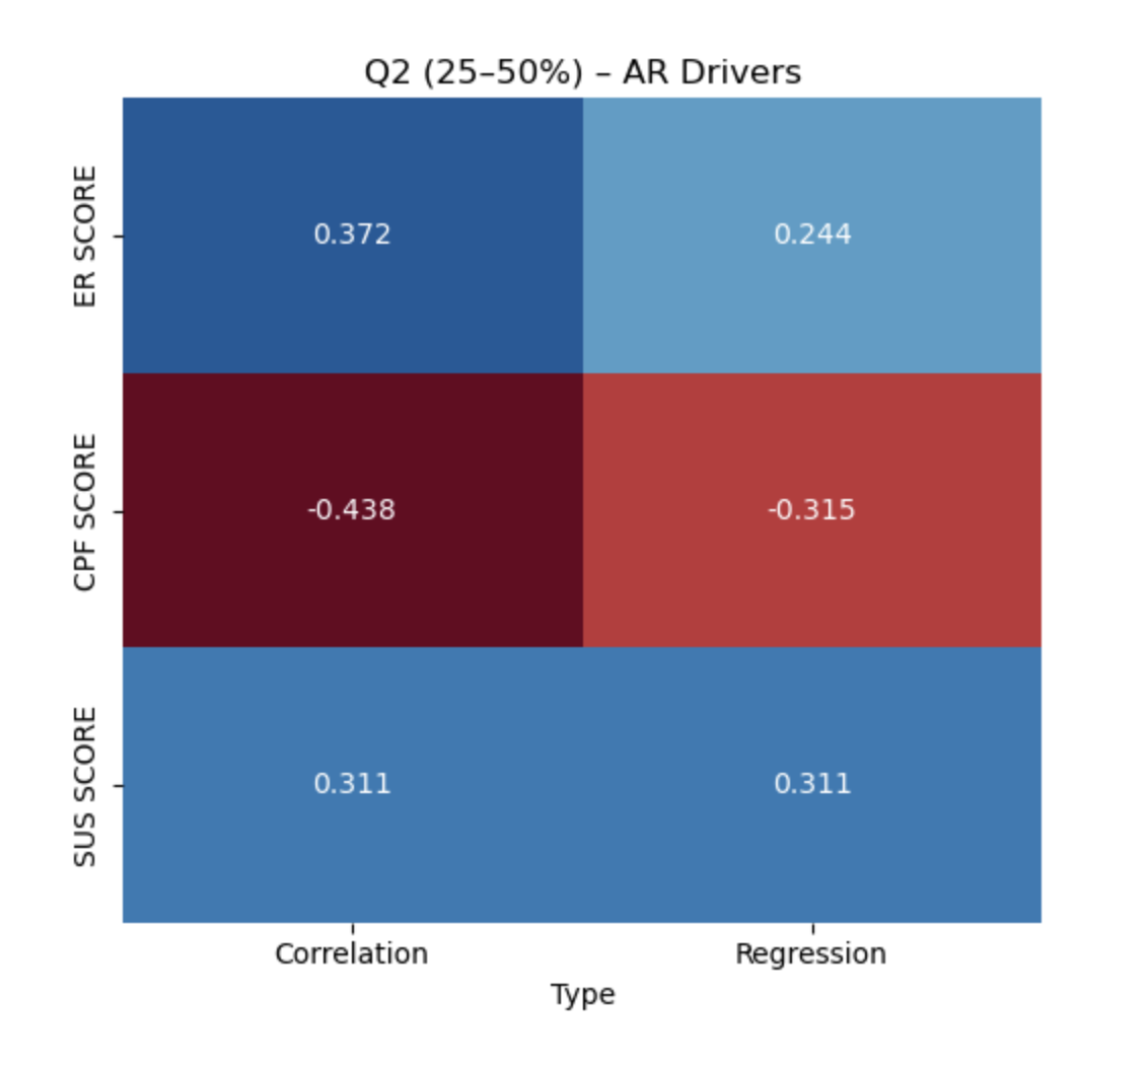
The analysis reveals 2 indicators stand out for non-elite universities (Q2–Q3):
Employer Reputation (ER) — 15% weighting
Measures how institutions and their programs are viewed by employers via the Employer Survey.
Sustainability (SUS) — 5% weighting
New indicator (introduced ~2024) measuring environmental, social, and governance (ESG) factors. Looks at UN SDGs, campus sustainability projects, diversity & governance.
Citations per Faculty (CPF) — 20% weighting
Captures research output and visibility — average citations per academic staff, normalized by faculty size. Reflects scholarly publications, collaboration, and visibility in academic literature.
Regression Analysis Results
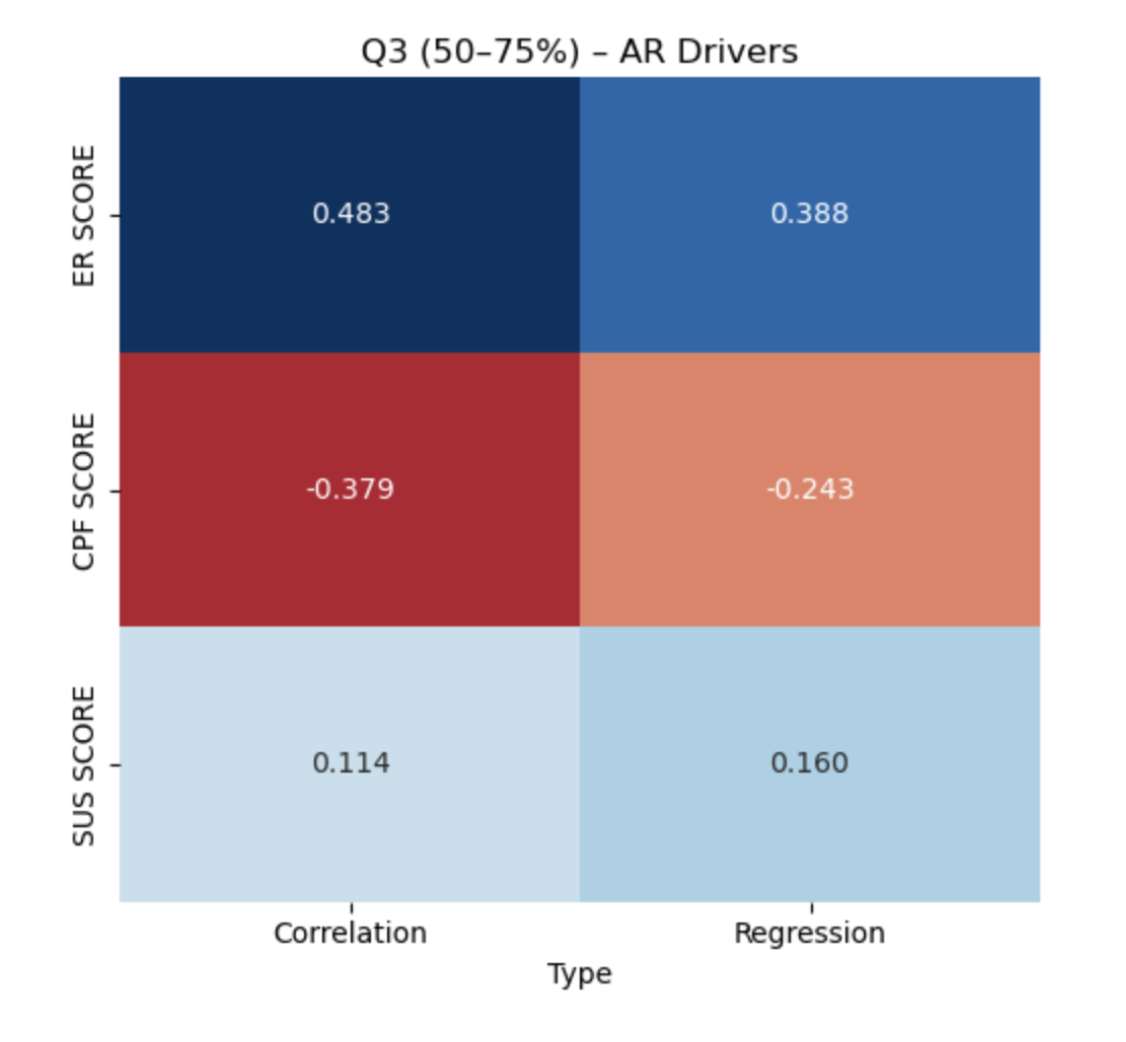
Multiple Linear Regression allows us to test all predictors together. It answers: “When universities have the same SUS, does ER still predict AR?”
What the Regression Shows for Q2–Q3:
- Employer Reputation (ER) → remains a strong positive driver of AR, especially in Q3
- Sustainability (SUS) → positive influence, strongest in Q2
- Citations per Faculty (CPF) → weak or negative, meaning research output alone does not raise AR outside top-tier schools
- R² ~ 0.30–0.35 → these 3 factors explain about one-third of the variation in AR
Main Insights & Recommendations
For Universities (Q2–Q3)
Employer Reputation (ER)
Since ER makes up 15% of the weight, focusing on employability gives non-elite schools a potential path to strengthening their reputation.
Citations per Faculty (CPF)
Although CPF carries a 20% weighting, its influence on reputation outside the top tier appears weaker. A strong research profile is valuable, but may not always reflect the undergraduate experience.
Sustainability (SUS)
Despite only 5% weighting, because it is new and less saturated, schools that actively engage in sustainability may benefit more. This indicator signals a university’s forward-looking values.
For Undergraduate Students
When evaluating non-elite universities, consider:
- Career outcomes — How do employers view the university?
- Sustainability initiatives — Does the school align with your values around ESG?
Analysis Method
- Python (pandas, NumPy, matplotlib, seaborn, plotly, scikit-learn, statsmodels) for analysis & visualization
- Data cleaning, merging & creation of derived variables
- Exploratory Data Analysis (EDA) to uncover trends & patterns
- Tableau for interactive dashboards
- Excel for supplementary analysis
Tableau Dashboard
To check dashboard Tableau Story.
Project Files
For more details see GitHub Project Folder.